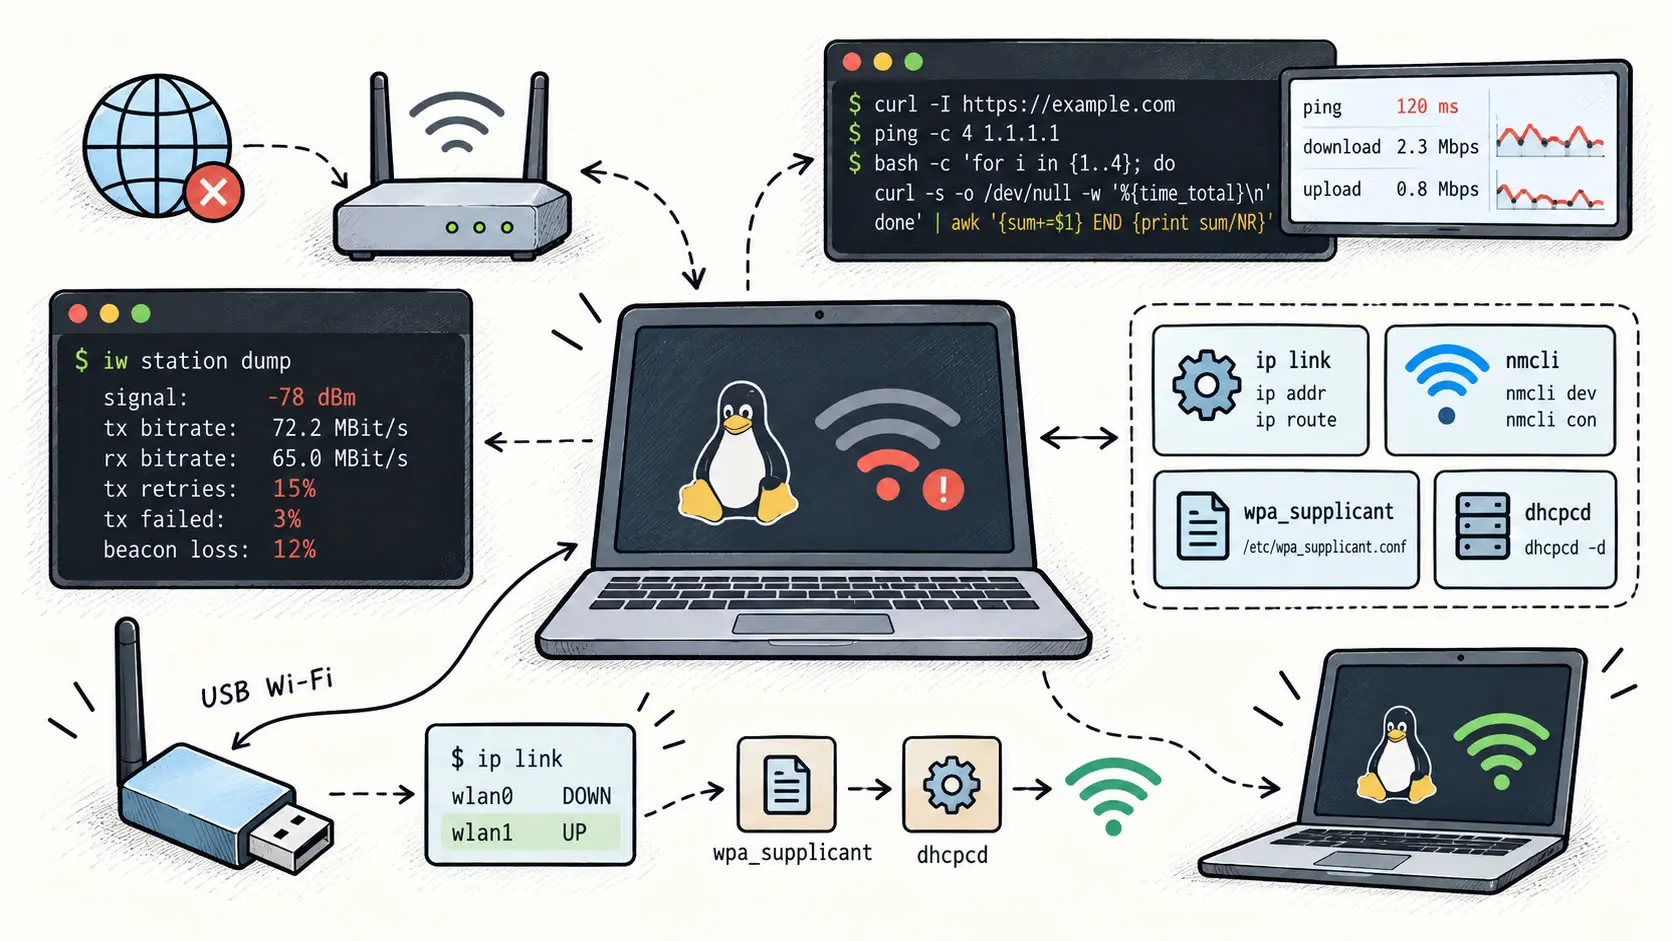
About a week ago, I needed to set up a laptop for my mum to use while working remotely.
The initial plan sounded trivial: install Debian, GNOME, connect it to Wi-Fi, and call it a day.
Of course, the Wi-Fi part turned out to be considerably more interesting.
The connection provided by the laptop's internal Wi-Fi adapter was slow and unstable, so instead of simply opening Speedtest and accepting whatever number it gave me, I started investigating what was actually happening.
That investigation progressively took me through several layers of the Linux networking stack.
First, we'll measure the quality of the connection ourselves using curl, ping, Bash and AWK. We'll separate DNS resolution, TCP connection establishment, TLS negotiation, server response time and transfer time, then calculate averages and standard deviations with an optimized formula using AWK. We'll also measure actual download throughput.
Then we'll move below HTTP and inspect the Wi-Fi link itself with iw: received signal strength in dBm (we'll see the formula), transmit and receive bitrates, retries, failed transmissions, dropped frames and beacon losses. This lets us distinguish a slow Internet connection from a bad radio link between the laptop and the access point.
Because the internal Wi-Fi adapter turned out to be part of the problem, we'll then add a USB Wi-Fi dongle and see how Linux detects USB hardware through vendor and product IDs, how those IDs relate to the kernel driver, and how to check and load the corresponding kernel module.
From there, we'll dig into what Linux actually exposes as a network interface with ip link: UP, LOWER_UP, NO-CARRIER, BROADCAST, MULTICAST, MTUs, interface states, groups, transmit queue lengths and queueing algorithms such as fq_codel.
Finally, we'll look at the two practical ways of bringing the Wi-Fi connection up: using NetworkManager through nmcli, or doing it manually with ip, iw, wpa_supplicant and dhcpcd. Along the way we'll distinguish SSIDs from BSSIDs, see how multiple access points can advertise the same network name, obtain an IP configuration through DHCP, and finish by reading the Linux routing table to understand exactly where outgoing packets will go.
Analyzing the connection quality
First, I noticed the connection was slow, so I did what all programmers should do and not go to https://speedtest.net but rather write a custom bash script utility that would give informations on:
- Latency, which that includes
time_namelookup-> time until the DNS resolution is finishedtime_connect-> time until the TCP connection between the remote host is establishedtime_app_connect-> time until the application-layer connection/handshake is completed. For HTTPS, this is essentially the TLS handshake completion time.time_pretransfer-> cumulated time of the previous operationstime_starttransfer-> TTFB, time until curl receives the first byte from the servertime_total-> cumulative time from the start until the entire operation is finished
You note that it's time until so time_strattransfer > time_appconnect for example and time_total != time_pretransfer + time_starttransfer because both durations are measure from the same starting point.
The architecture is simple curl n times and output the durations into a CSV from which we'll compute the average and the standard deviation of each variable with our good old friend AWK.
printf in AWK we'll be used for formating the results.
#!/usr/bin/env bash
INTR_WIFI="${1:-wlp3s0}"
URL="${2:-https://google.com}"
COUNT="${3:-20}"
OUTPUT="${4:-latency_results.csv}"
export LC_NUMERIC=C
echo "timestamp,dns,tcp,tls,pretransfer,ttfb,total" > "$OUTPUT"
for ((i=1; i<=COUNT; i++)); do
echo "Test $i/$COUNT..."
curl -o /dev/null -s \
-w "$(date --iso-8601=seconds),%{time_namelookup},%{time_connect},%{time_appconnect},%{time_pretransfer},%{time_starttransfer},%{time_total}\n" \
"$URL" >> "$OUTPUT"
sleep 1
done
echo
echo "Resuls written inside : $OUTPUT"
echo
awk -F',' '
NR == 1 { next }
{
# Temps cumulés retournés par curl
dns = $2
connect = $3
appconnect = $4
pretransfer = $5
starttransfer = $6
total = $7
# Durées propres de chaque phase
phase[1] = dns
phase[2] = connect - dns
phase[3] = appconnect - connect
phase[4] = starttransfer - pretransfer
phase[5] = total - starttransfer
for (i = 1; i <= 5; i++) {
sum[i] += phase[i]
sumsq[i] += phase[i] * phase[i]
}
n++
}
END {
names[1] = "DNS"
names[2] = "TCP"
names[3] = "TLS"
names[4] = "Serveur"
names[5] = "Transfert"
printf "%-12s %12s %12s\n",
"Stage", "Average", "Std"
for (i = 1; i <= 5; i++) {
mean = sum[i] / n
variance = sumsq[i] / n - mean * mean
if (variance < 0)
variance = 0
stddev = sqrt(variance)
printf "%-12s %9.3f ms %9.3f ms\n",
names[i],
mean * 1000,
stddev * 1000
}
}' "$OUTPUT"
When it comes to the formatting, we use the %12s, it means a 12 characters reserved space where the content will be right-alogned.
And the %12-s means the same thing, but the content is left-aligned.
Now, you also note that I didn't use the well-known formula for the variance which is:
$$ \begin{aligned} \frac{\sum_{i=1}^{n} (x_i - \bar{x})^2}{n} \end{aligned} $$
Which would require AWK to keep an array of the x_i because at first I need to compute the average and then use it in the formula.
therefore, I used the equivalent:
$$ \begin{aligned} \frac{\sum_{i=1}^{n} x_i^2}{n} - \bar{x}^2 \end{aligned} $$
Like that I can compute in one pass the:
$$ \begin{aligned} \sum_{i=1}^{n} x_i^2 \end{aligned} $$
And the:
$$ \begin{aligned} \bar{x} \end{aligned} $$
So I just have to do:
sumsq[i] / n - mean * mean
At the end to compute the variance.
Indeed:
$$ \begin{aligned} \frac{\sum_{i=1}^{n} \left(x_i - \bar{x}\right)^2}{n} \end{aligned} $$
$$ \begin{aligned} \equiv \end{aligned} $$
$$ \begin{aligned} \frac{1}{n} \sum_{i=1}^{n} (x_i - \bar{x})^2 \end{aligned} $$
$$ \begin{aligned} \equiv \end{aligned} $$
$$ \begin{aligned} \frac{1}{n} \sum_{i=1}^{n} \left( x_i^2 - 2x_i\bar{x} + \bar{x}^2 \right) \end{aligned} $$
$$ \begin{aligned} \equiv \end{aligned} $$
$$ \begin{aligned} \frac{1}{n} \left( \sum_{i=1}^{n} x_i^2 -2\bar{x}\sum_{i=1}^{n} x_i + \sum_{i=1}^{n} \bar{x}^2 \right) \end{aligned} $$
$$ \begin{aligned} \equiv \end{aligned} $$
$$ \begin{aligned} \frac{1}{n} \left( \sum_{i=1}^{n} x_i^2 - 2\bar{x}\sum_{i=1}^{n} x_i + n\bar{x}^2 \right) \end{aligned} $$
$$ \begin{aligned} \equiv \end{aligned} $$
$$ \begin{aligned} \frac{1}{n}\sum_{i=1}^{n} x_i^2 - 2\bar{x}\frac{1}{n}\sum_{i=1}^{n} x_i + \bar{x}^2 \end{aligned} $$
$$ \begin{aligned} \equiv \end{aligned} $$
$$ \begin{aligned} \frac{1}{n}\sum_{i=1}^{n} x_i^2 - 2\bar{x}^2 + \bar{x}^2 \end{aligned} $$
$$ \begin{aligned} \equiv \end{aligned} $$
$$ \begin{aligned} \frac{1}{n}\sum_{i=1}^{n} x_i^2 - \bar{x}^2 \end{aligned} $$
After that, I'll use:
iw dev "$INTR_WIFI" station dump
to get the variables about the quality of the connection through my current wifi interface.
The quality of the signal is described with the folowing variables:
signal_dbm
This is the strenght of the signal at the latest measurement.
Its formula is:
$$ \begin{aligned} P_{dBm} = 10 \cdot \log_{10}\left(\frac{P}{1 \mathrm{mW}}\right) \end{aligned} $$
Where P is the power received by the physical interface.
So in other terms:
$$ \begin{aligned} \frac{P_{dBm}}{10} = \log_{10}\left(\frac{P}{1\ \mathrm{mW}}\right) \end{aligned} $$
$$ \begin{aligned} \equiv \end{aligned} $$
$$ \begin{aligned} 10^{\frac{P_{dBm}}{10}} = \frac{P}{1 \mathrm{mW}} \end{aligned} $$
$$ \begin{aligned} \equiv \end{aligned} $$
$$ \begin{aligned} P = 1 \mathrm{mW} * 10^{\frac{P_{dBm}}{10}} \end{aligned} $$
Therefore, of course, the more P increases, the more PdBm increases.
We use a logarithmic scale to detect a wide variation of signal strenght, even very tiny one.
signal_avg
It's the same as signal_dbm but averaged through the latest measurements maitained by the kernel driver.
tx_mbps
Is the latest transmiting bitrate reported by the driver in Mbit/s.
This is the physical propriety of the wifi interface, not the raw frequency at which the interface is receiving data, because the protocol has some overhead.
As you noticed the t stands for "transmited".
rx_mbps
This is the same as tx_mbps but for receiving data, as you noticed the r stands for "received".
tx_retries
Number of additional transmission attempts performed because previously transmitted Wi-Fi frames were not acknowledged successfully.
tx_packets
Total number of packets/frames transmitted by the Wi-Fi station.
A frame is basically the data unit at the interface layer, while a packet usually means the data unit at the network layer.
retry_pct
Ratio computed as:
tx_retries / tx_packets * 100
This represents the number of retransmission attempts relative to transmitted packets.
It is NOT the percentage of packets that were lost or retried, since a single packet may require multiple retries.
tx_failed
Number of transmitted frames that ultimately failed even after all retry attempts.
Unlike tx_retries, this indicates definitive transmission failures.
rx_drop
That's the total amount of frames received but that the kernel of the interface dropped for various reasons (maybe malformed...).
beacon_loss
A beacon is a small management frame that a Wi-Fi access point sends periodically to announce that the network exists and to provide information about it.
It contains things like the SSID (network name), timing information, supported capabilities, channel-related information, and other parameters clients need to stay synchronized with the Access Point.
Typically, Access Point send beacons around every 100 ms, though the interval is configurable.
beacon_loss therefore means the client detected that it missed enough expected beacon frames from the access point to count a beacon-loss event.
Most counters above (tx_packets, tx_retries, tx_failed, beacon_loss, rx_drop) are cumulative since the Wi-Fi association/interface was established.
That's why I should take those variables values before the ping -q -c 10 ... and subsytract them to the values I'll have after this step.
So it looks like:
before=$(sudo iw dev "$INTR_WIFI" station dump)
ping -q -c 10 "$(ip route | awk '/default/ {print $3; exit}')"
printf "\n"
after=$(sudo iw dev "$INTR_WIFI" station dump)
printf '%s\n---AFTER---\n%s\n' "$before" "$after" | awk '
$0 == "---AFTER---" {
after = 1
next
}
$1 == "tx" && $2 == "packets:" {
if (after)
tx_packets_after = $3
else
tx_packets_before = $3
}
$1 == "tx" && $2 == "retries:" {
if (after)
tx_retries_after = $3
else
tx_retries_before = $3
}
$1 == "tx" && $2 == "failed:" {
if (after)
tx_failed_after = $3
else
tx_failed_before = $3
}
$1 == "beacon" && $2 == "loss:" {
if (after)
beacon_loss_after = $3
else
beacon_loss_before = $3
}
$1 == "rx" && $2 == "drop" && $3 == "misc:" {
if (after)
rx_drop_after = $4
else
rx_drop_before = $4
}
# These are not cumulative counters, so we just keep the final/current values.
$1 == "signal:" && after {
signal = $2
}
$1 == "signal" && $2 == "avg:" && after {
signal_avg = $3
}
$1 == "tx" && $2 == "bitrate:" && after {
tx_bitrate = $3
}
$1 == "rx" && $2 == "bitrate:" && after {
rx_bitrate = $3
}
END {
tx_packets = tx_packets_after - tx_packets_before
tx_retries = tx_retries_after - tx_retries_before
tx_failed = tx_failed_after - tx_failed_before
beacon_loss = beacon_loss_after - beacon_loss_before
rx_drop = rx_drop_after - rx_drop_before
retry_ratio = tx_packets ? (tx_retries / tx_packets) * 100 : 0
printf "%12s,%12s,%12s,%12s,%12s,%12s,%12s,%12s,%12s,%12s\n",
"signal_dbm",
"signal_avg",
"tx_mbps",
"rx_mbps",
"tx_retries",
"tx_packets",
"retry_pct",
"tx_failed",
"beacon_loss",
"rx_drop"
printf "%12.0f,%12.0f,%12.1f,%12.1f,%12d,%12d,%12.2f,%12d,%12d,%12d\n",
signal,
signal_avg,
tx_bitrate,
rx_bitrate,
tx_retries,
tx_packets,
retry_ratio,
tx_failed,
beacon_loss,
rx_drop
}'
printf "\n"
Download througput
For the download throughput, that's simple.
Indeed, I already have my VPS on which this blog is running on.
This server exposes a file access endpoint for displaying images and providing data etcetera at:
https://julienlargetpiet.tech/assets/common_files/
So what I did was ssh to the VPS and create some files of different sizes at this access point so I can download them with cURL.
For example:
fallocate -l 50M 50M.bin
cURL will also provide the averaged throughput for the file download.
I do not want to save the file of course, so I will throw it away in /dev/null.
So, I'll use this command:
curl -o /dev/null -w '%{speed_download}\n' https://julienlargetpiet.tech/assets/common_files/50M.bin | awk '{printf "Download: %.2f Mbit/s\n", $1*8/1000000}'
As you see I help the formating with AWK.
Results
Here are the results I had through the internal Wi-Fi antenna.
Test 1/20...
Test 2/20...
Test 3/20...
Test 4/20...
Test 5/20...
Test 6/20...
Test 7/20...
Test 8/20...
Test 9/20...
Test 10/20...
Test 11/20...
Test 12/20...
Test 13/20...
Test 14/20...
Test 15/20...
Test 16/20...
Test 17/20...
Test 18/20...
Test 19/20...
Test 20/20...
Resuls written inside : latency_results.csv
Stage Average Std
DNS 38.421 ms 27.813 ms
TCP 92.734 ms 68.551 ms
TLS 141.382 ms 96.427 ms
Server 184.765 ms 132.218 ms
Transfer 4.813 ms 7.942 ms
### Router connection test ###
PING 192.168.1.1 (192.168.1.1) 56(84) bytes of data.
--- 192.168.1.1 ping statistics ---
10 packets transmitted, 8 received, 20% packet loss, time 9021ms
rtt min/avg/max/mdev = 18.447/74.862/284.391/81.527 ms
signal_dbm, signal_avg, tx_mbps, rx_mbps, tx_retries, tx_packets, retry_pct, tx_failed, beacon_loss, rx_drop
-79, -77, 26.0, 39.0, 31, 24, 129.17, 3, 7, 18
% Total % Received % Xferd Average Speed Time Time Time Current
Dload Upload Total Spent Left Speed
100 50.0M 100 50.0M 0 0 412k 0 0:02:04 0:02:04 --:--:-- 528k
Download: 3.37 Mbit/s
DONE
As you notice, that's a poor connection with high and non constant latency.
We can dig deeper by analyzing the variables such as signal_dbm, tx_retries and tx_failed for example.
Indeed they show a really poor connection quality.
The Wi-Fi dongle
I couldn't move the portable PC from the desk, so the internal wifi antenna might have been in a poorly deserved place for the Wi-Fi.
Therefore, I decided to plug a Wi-Fi dongle to have more control on where to place the antenna to get a better throughput.
But of course that's not plug and play.
First I did:
sudo dmesg -c
To clear out the history of USB devices connections and then I launched.
sudo dmesg -w
And then plugged my Wi-Fi dongle to the PC.
I've received informations anbout the VendorID and ProductID of the dongle I've just plugged.
For example, my mic on this PC gives:
[11922.086985] usb 1-3: new full-speed USB device number 9 using xhci_hcd
[11922.384885] usb 1-3: New USB device found, idVendor=0d8c, idProduct=0005, bcdDevice= 1.00
[11922.384890] usb 1-3: New USB device strings: Mfr=1, Product=2, SerialNumber=3
[11922.384892] usb 1-3: Product: WOODBRASS UM1
[11922.384894] usb 1-3: Manufacturer: JMDZ MICROPHONE
[11922.384896] usb 1-3: SerialNumber: 20211207
[11922.497943] hid-generic 0003:0D8C:0005.0006: hidraw0: USB HID v1.11 Device [JMDZ MICROPHONE WOODBRASS UM1] on usb-0000:02:00.0-3/input2
As you see, here the VendorID is 0d8c and the ProductID is 0005.
The VendorID identifies the manufacturer among the l’USB-IF.
And the ProductID is chosen by the manufacturer to indetify the model.
Those lines gives the same information in human-readable format:
[11922.384892] usb 1-3: Product: WOODBRASS UM1 # ProductId
[11922.384894] usb 1-3: Manufacturer: JMDZ MICROPHONE # VendorId
I also can do lsusb before and after plugging my dongle and see the newline that have appeared.
For example, on the PC I'm writing the article I have:
❯ lsusb
Bus 001 Device 001: ID 1d6b:0002 Linux Foundation 2.0 root hub
Bus 001 Device 002: ID 2109:2817 VIA Labs, Inc. USB2.0 Hub
Bus 001 Device 004: ID 8087:0029 Intel Corp. AX200 Bluetooth
Bus 001 Device 005: ID 0b05:1939 ASUSTek Computer, Inc. AURA LED Controller
Bus 001 Device 006: ID 05e3:0610 Genesys Logic, Inc. Hub
Bus 001 Device 007: ID 1bcf:0005 Sunplus Innovation Technology Inc. Optical Mouse
Bus 001 Device 008: ID 046d:c31c Logitech, Inc. Keyboard K120
Bus 001 Device 009: ID 0d8c:0005 C-Media Electronics, Inc. Blue Snowball
Bus 002 Device 001: ID 1d6b:0003 Linux Foundation 3.0 root hub
Bus 002 Device 002: ID 2109:0817 VIA Labs, Inc. USB3.0 Hub
Bus 003 Device 001: ID 1d6b:0002 Linux Foundation 2.0 root hub
Bus 004 Device 001: ID 1d6b:0003 Linux Foundation 3.0 root hub
Bus 005 Device 001: ID 1d6b:0002 Linux Foundation 2.0 root hub
Bus 006 Device 001: ID 1d6b:0003 Linux Foundation 3.0 root hub
We have the VendorID:ProductID here of all the usb devices:
ID 1d6b:0002
ID 2109:2817
ID 8087:0029
ID 0b05:1939
ID 05e3:0610
ID 1bcf:0005
ID 046d:c31c
ID 0d8c:0005
ID 1d6b:0003
ID 2109:0817
ID 1d6b:0002
ID 1d6b:0003
ID 1d6b:0002
ID 1d6b:0003
The id for my fongle was:
2357:0138
Now I can search the chipset associated to VendorId 2357 and the Product Id 0138 on https://catee.net.
More precisely here:
https://cateee.net/sources/lkddb/
And because I was on Linux kernel version 6.12 (you get it via the command uname -r).
We have to look inside this file:
https://cateee.net/sources/lkddb/lkddb-6.12.list
And bingo we found this line corresponding to the exact chipset:
usb 2357 0138 .. .. .. ff ff ff 0000 ffff : CONFIG_RTW88 CONFIG_RTW88_8822BU CONFIG_WLAN CONFIG_WLAN_VENDOR_REALTEK : drivers/net/wireless/realtek/rtw88/rtw8822bu.c
What's usefull in our case is the one terminating with "bu", because that's the USB variant.
Now we just make sure we have a correspondig driver with:
❯ find /lib/modules/$(uname -r) -name 'rtw88_8822bu.ko*'
/lib/modules/7.0.0-28-generic/kernel/drivers/net/wireless/realtek/rtw88/rtw88_8822bu.ko.zst
Nice, that's already installed !
Now we just load it:
sudo modprobe rtw88_8822bu
At this point when we type ip link in the shell, the interface should appear.
For example, on my current computer I have:
❯ ip link
1: lo: <LOOPBACK,UP,LOWER_UP> mtu 65536 qdisc noqueue state UNKNOWN mode DEFAULT group default qlen 1000
link/loopback 00:00:00:00:00:00 brd 00:00:00:00:00:00
2: enp7s0: <NO-CARRIER,BROADCAST,MULTICAST,UP> mtu 1500 qdisc fq_codel state DOWN mode DEFAULT group default qlen 1000
link/ether fc:34:97:67:a8:93 brd ff:ff:ff:ff:ff:ff
3: wlp6s0: <BROADCAST,MULTICAST,UP,LOWER_UP> mtu 1500 qdisc noqueue state UP mode DORMANT group default qlen 1000
link/ether 70:9c:d1:62:92:3d brd ff:ff:ff:ff:ff:ff
4: docker0: <NO-CARRIER,BROADCAST,MULTICAST,UP> mtu 1500 qdisc noqueue state DOWN mode DEFAULT group default
link/ether be:63:19:78:fd:64 brd ff:ff:ff:ff:ff:ff
5: br-83d249e18dae: <NO-CARRIER,BROADCAST,MULTICAST,UP> mtu 1500 qdisc noqueue state DOWN mode DEFAULT group default
link/ether 9e:89:1c:05:0e:e8 brd ff:ff:ff:ff:ff:ff
First, we will explain all the flags inside the <...>.
Here we see that all interfaces are UP, meaning the Linux kernel has enabled this interface, this means this interface is allowed to participate in networking.
That's mostly done with:
sudo ip link set dev $INTERFACE_NAME up
Now, LOWER_UP means the lower networking layer is actually working.
For Ethernet, that usually means a physical link is detected.
For Wi-Fi, it generally means the interface has a working association/link at the driver level.
Now, we'll explain the differences between UNICAST, BROADCAST and MULTICAST, those are flags in the <...> interface placeholders designating the protocols supported.
But first, we need to make the distinction between the layers.
A packet can be encapsulated like this:
Application
|
V
TCP / UDP
|
V
IPv4 / IPv6
|
V
Ethernet / Wi-Fi
|
V
Physical medium
The Ethernet frame is Layer 2.
The IPv4 packet inside it is Layer 3.
Now:
-
UNICAST: one sender -> one specific receiver -
BROADCAST: one sender -> everyone in the local broadcast domain -
MULTICAST: one sender -> a selected group of receivers
- Ethernet / Wi-Fi: Layer 2
At Layer 2, devices communicate using MAC addresses.
Normally, each network interface has its own individual MAC address:
- PC A ->
70:9c:d1:62:92:3d - PC B ->
10:20:30:40:50:60 - Phone ->
8a:12:34:56:78:90 - Router ->
00:11:22:33:44:55
So devices on the same VLAN do not share the same individual MAC address.
However, there are also special destination MAC addresses that are shared conceptually by many devices.
The most important one is the Ethernet broadcast address:
ff:ff:ff:ff:ff:ff
Every interface in the same Layer-2 broadcast domain accepts frames sent to that destination.
So although devices have different personal MAC addresses, they all recognize the same broadcast MAC address.
You can think of it like this:
-
individual
MAC= "this frame is specifically for me" -
ff:ff:ff:ff:ff:ff= "this frame is for everybody here"
MULTICAST works similarly, but instead of one universal broadcast address, there are many multicast MAC addresses representing different groups.
For IPv4 multicast, Ethernet multicast MACs often begin with:
01:00:5e:...
So at Layer 2:
-
UNICAST-> one specificMACaddress -
BROADCAST->ff:ff:ff:ff:ff:ff -
MULTICAST-> a multicast groupMACaddress
- IPv4: Layer 3
IPv4 uses IP addresses instead of MAC addresses.
For example:
192.168.1.20
is a unicast IPv4 address.
IPv4 also supports broadcast.
For this subnet:
192.168.1.0/24
(The /24 means the 24 first bits are masked to 192.168.1, so the sibnet goes from 192.168.1 to 192.168.1.255)
the broadcast address is usually:
192.168.1.255
A packet sent there means roughly:
"send this IPv4 packet to all hosts on this subnet"
When that packet is sent over Ethernet, the layers may look like:
Ethernet destination:
ff:ff:ff:ff:ff:ff
IPv4 destination:
192.168.1.255
The first is a Layer-2 MAC address.
The second is a Layer-3 IPv4 address.
IPv4 multicast uses addresses from:
224.0.0.0/4
(So it goes from 224.0.0.0 to 239.255.255.255)
for example:
239.1.2.3
That IPv4 multicast address can then be mapped onto an Ethernet multicast MAC address.
- IPv6: Layer 3
IPv6 is different because it has no broadcast.
IPv6 relies heavily on multicast instead.
For example:
ff02::1
means all IPv6 nodes on the local link.
So:
-
IPv4:
UNICAST,BROADCAST,MULTICAST -
IPv6:
UNICAST,MULTICAST
- VLANs
A VLAN separates one Layer-2 network from another.
Imagine:
Switch
|-- VLAN 10
| |-- PC A
| |-- PC B
|
|-- VLAN 20
|-- PC C
|-- PC D
If PC A sends an Ethernet broadcast to:
ff:ff:ff:ff:ff:ff
PC B can receive it.
PC C and PC D do not, because they are in a different VLAN.
Each device still has its own MAC.
What they share is access to the same Layer-2 broadcast domain and recognition of special addresses such as:
ff:ff:ff:ff:ff:ff
Now, what are the other parameters such as mtu, qlen, mode, state, qdisc and group ?
mtu
This means the maximum transmission unit.
It is the maximum size of a Layer-3 packet that this interface can normally carry in one Layer-2 frame without fragmentation.
This value:
mtu 1500
Means that this interface can carry an IP packet of up to 1500 bytes in one normal frame.
The loopback has a mtu value of 65536 -> 2^16 because there is no physical Ethernet frame limitation, so Linux uses the maximum allowed mtu value.
Therefore, we see that the mtu is encoded on a int16.
qdisc
This means queueing discipine.
When the kernel wants to transmit packets, it must wait and follow the protocol designated by the qdisc value of the interface the traffic goes through.
More precisely, instread of packtes being smply in FIFO (First In First Out), there exists smarter queueing discipline that will decide how packets waiting for transmission should be queued, ordered, delayed, dropped, prioritized, etc.
For my Ethernet interface enp7s0, its value is fq_codel (Fair Queueing Controled Delay).
Its goal is largely to avoid excessive queueing delay, especially bufferbloat.
It's designed to solve two problems at once:
- one traffic flow monopolizing the transmit queue
- and packets sitting in that queue for too long
Imagine the interface can transmit at 100 Mbit/s, but applications temporarily produce packets faster than that.
Without intelligent queue management, that queue can grow large. Packets then spend a long time waiting before even reaching the wire. That is queueing delay, and if buffers become huge you get bufferbloat.
For example, suppose we're downloading a large file while using SSH:
large download:
D D D D D D D D D D D D ...
SSH:
S
With a simple FIFO queue, the SSH packet might have to wait behind many download packets:
[D][D][D][D][D][D][D][D][S]
↑
must wait
The bandwidth might still be excellent, but interactive latency (SSH) becomes awful.
fq_codel tackles this in two parts.
fq = Fair Queueing
Instead of treating all traffic as one giant queue, fq_codel classifies packets into different flows.
flow 1: web download [D][D][D][D]
flow 2: SSH [S]
flow 3: DNS [N]
flow 4: video [V][V]
It then rotates at a constant rate between those flows to handle packets more fairly.
Each flow have its own small queue.
codel = Controlled Delay
Fairness alone does not prevent the queue from being too large.
While codel wtaches how long packets have been siting in the queue.
If packets consistently spend too much time in the queue, codel interprets that as a persistent congestion.
So, instead of leting the queue grow indefinitly, it starts dropping packets.
At first, it sounds like a counter-productive idea, because it just means that some work needs to be performed in order to resend the dropped packets.
But, we have to think in term of the relationship with TCP, in other terms, the effect it has on the latter.
Because packet loss is a congestion signal for TCP.
Therefore, when TCP sees dropped packet, it starts reducing its sending rate.
So, we have:
sender sends too quickly
|
V
queue builds
|
V
CoDel detects excessive delay
|
V
packet dropped / ECN marked
|
V
TCP notices congestion
|
V
TCP slows down
|
V
queue shrinks
|
V
latency improves
One subtle point, fq_codel is mainly managing the outgoing queue for that interface.
So, it's primarily about packets Linux is preparing to transmit through the interface, not incoming packets from the network.
We can inspect stats about this protocol for an interface that uses it with:
tc -s qdisc show dev enp7s0
Possbible Output:
qdisc fq_codel 0: root refcnt 2 limit 10240p flows 1024 quantum 1514 target 5ms interval 100ms memory_limit 32Mb ecn drop_batch 64
Sent 1845239012 bytes 1458321 pkt (dropped 327, overlimits 0 requeues 184)
backlog 7420b 6p requeues 184
maxpacket 1514 drop_overlimit 12 new_flow_count 58321 ecn_mark 47
new_flows_len 3 old_flows_len 18
-
limit 10240p-> maximum total queue size is 10,240 packets -
flows 1024->fq_codelcan hash traffic into up to 1024 flow queues -
quantum 1514-> roughly how many bytes a flow can transmit per scheduling turn before moving to another flow -
target 5ms->codelaims to keep persistent queueing delay around or below5 ms -
interval 100ms-> the time scalecodeluses to judge whether high delay is persistent -
memory_limit 32Mb-> queue memory is capped at32 MB -
ecn-> ECN marking is enabled where applicable, so congestion can sometimes be signaled without dropping a packet
For ecn, that's:
queue delay becomes persistently too high
|
V
CoDel decides congestion must be signaled
|
V
if packet is ECN-capable
-> mark it with CE
otherwise
-> drop it
drop_batch 64-> when bulk dropping is needed, the implementation may process drops in batches up to64packets.
The interface sent about 1.85GB through 1.46M packets.
327 packets were dropped by qdisc.
This:
backlog 7420b 6p
Means that at the instant I ran the command, 6 packets totaling 7420 bytes were still waiting to be transmitted.
maxpacket 1514
The largest packet observed by this qdisc was 1514 bytes.
requeues 184
Means:
queue delay becomes persistently too high
|
V
CoDel decides congestion must be signaled
|
V
if packet is ECN-capable
-> mark it with CE
otherwise
-> drop it
Also, 47 packets were marked using ECN instead of being dropped to signal congestion.
And this:
new_flows_len 3
old_flows_len 18
Means that at this moment fq_codel has:
-
3 flows in its "new flows" list
-
18 flows in its "old flows" list
This comes from the fair-queuing scheduler.
Indeed, newly active flows initially get favorable treatment so that short interactive flows; DNS, SSH, small web requests, etc, aren't stuck behind long-running transfers.
Now:
new_flow_count 58321
Is of course the total number of new flow that the protocol handled, but a new flow is not necessary a new TCP connection.
For example, 2 ssh requests for can have a huge interval of time between them, so at the second ssh request, it's considered as a new flow.
Now, overlimits is a qdisc counter that records how many times the qdisc had to apply some kind of limit or traffic-control action because traffic exceeded what it was currently allowed to send.
The exact meaning depends on the qdisc protocol.
For fq_codel, this:
overlimits 0
usually stays 0, because fq_codel is not mainly a rate limiter.
It manages fairness and queue delay rather than enforcing a fixed bandwidth ceiling.
So if I have overlimits 10, it doesn't mean 10 packets were dropped, those are separate counter.
For example:
Sent 1000000 bytes 1000 pkt
(dropped 5, overlimits 20 requeues 3)
could mean:
dropped 5 -> 5 packets were actually discarded
requeues 3 -> 3 packets had to be queued again
overlimits 20 -> the qdisc hit/enforced one of its traffic-control limits 20 times
With shaping qdiscs such as TBF or HTB, overlimits is much more meaningful because they explicitly enforce a configured rate.
Conceptually:
sender produces traffic
|
V
qdisc says:
"you've exceeded the allowed rate for now"
|
V
overlimits++
The packet may then be delayed rather than dropped.
qlen
This means the queue length of the interface in term of packets.
We can configure it, for example:
sudo ip link set dev enp7s0 txqueuelen 500
state
It's not like the UP flag inside the <...>.
Indeed, the latter means the interface is administratively enabled, so it's allowed to operate while the state UP means that it is operational.
We can see the difference in my Ethernet interface for example:
2: enp7s0: <NO-CARRIER,BROADCAST,MULTICAST,UP> mtu 1500 qdisc fq_codel state DOWN mode DEFAULT group default qlen 1000
This is allowed to be operational, but because it has no physical link to my router, its state value is DOWN.
mode
It's not as usefull as the other variablkes from a user POV.
Indeed, it's usefull for interfaces where “the physical/link layer exists” is not enough to mean “the interface is ready for normal traffic.”
That’s the purpose of mode DORMANT.
For a simple Ethernet NIC (Network Interface Card), the logic is often basically:
interface enabled + cable/link detected = operational
So mode DEFAULT is fine.
But some interfaces have an extra protocol step.
Wi-Fi is a good example:
radio available
|
V
association with AP (Access Point)
|
V
authentication
|
V
possibly WPA handshake
|
V
usable link
The kernel needs a way to represent:
“the lower layer exists, but don’t necessarily treat this as fully ready yet.”
That’s where the dormant concept is useful.
group
This is not the same as the MULTICAST groups, this is just an administrative label used by ip link operations to apply operations to all the interfaces that belong to the same group.
An interface belongs to one group at the same time.
By default, all interfaces belong to the default (group 0) group.
We can add interfaces to a group like this:
sudo ip link set dev enp7s0 group 10
sudo ip link set dev wlp6s0 group 10
Then, we can see all the interfaces belonging to the group with:
sudo ip link show group 10
Output:
1: enp7s0: <NO-CARRIER,BROADCAST,MULTICAST,UP> mtu 1500 qdisc fq_codel state DOWN mode DEFAULT group default qlen 1000
link/ether fc:34:97:67:a8:93 brd ff:ff:ff:ff:ff:ff
2: wlp6s0: <BROADCAST,MULTICAST,UP,LOWER_UP> mtu 1500 qdisc noqueue state UP mode DORMANT group default qlen 1000
link/ether 70:9c:d1:62:92:3d brd ff:ff:ff:ff:ff:ff
Then, we can do things like:
sudo ip link set group 10 down/up
Final Setup
Now, I was able to connect to the AP.
I used nmcli:
sudo nmcli device wifi connect "AP-NAME" password "PASSWORD" ifname $INTERFACE_NAME
That command does more than just associate temporarily.
Indeed, NetworkManager (nmcli is the CLI client) normally creates a connection profile for that Wi-Fi network if needed.
If you want to get all the profiles name associate to a SSID (AP) and their related interface, do:
nmcli -t -f NAME,TYPE connection show |
while IFS=: read -r name type; do
[ "$type" = "802-11-wireless" ] || continue
ssid=$(nmcli -g 802-11-wireless.ssid connection show "$name")
iface=$(nmcli -g connection.interface-name connection show "$name")
if [ "$ssid" = "MySSID" ]; then
printf 'profile=%s interface=%s\n' "$name" "${iface:-ANY}"
fi
done
If we already had an interface connected to MySSID, then we we connected our second interface, it should have created the profile MySSID 1.
The profile label and the SSID can have the same name, but sometimes thay aren't, like:
-
SSID: Livebox-6189
-
label name: Home-Wifi
Then, we made the USB profile explicitly tied to the USB interface:
sudo nmcli connection modify "MySSID 1" connection.interface-name wlx14ebb68586a7
And enabled autoconnect:
sudo nmcli connection modify "MySSID 1" connection.autoconnect yes
Also, be carefull because the SSID is not a unique identifier, rather a human friendly identifier but when you scan the AP arround you with:
nmcli device wifi list
It can absolutely list different AP with the same SSID value such as "iPhone".
So for connecting, you won't use:
nmcli device wifi connect "SSID" password ifname $MY_INTERFACE
But rather grab a really unique Id, which is the BSSID with:
nmcli -f SSID,BSSID,CHAN,SIGNAL,SECURITY device wifi list
A BSSID looks like:
AA:BB:CC:DD:EE:FF
And provide the BSSID when connecting:
nmcli device wifi connect "SSID" bssid "BSSID" password ifname $MY_INTERFACE
You can also inspect which interface is connected to the AP with:
iw dev
Output:
phy#0
Unnamed/non-netdev interface
wdev 0x2
addr 70:9c:d1:62:92:3e
type P2P-device
Interface wlp6s0
ifindex 3
wdev 0x1
addr 70:9c:d1:62:92:3d
ssid Livebox-6142
type managed
channel 100 (5500 MHz), width: 80 MHz, center1: 5530 MHz
txpower 22.00 dBm
multicast TXQ:
qsz-byt qsz-pkt flows drops marks overlmt hashcol tx-bytes tx-packets
0 0 0 0 0 0 0 0 0
Its ifindex is 3 corresponding to wlp6s0.
-
channel 100-> the standardized Wi-Fi channel number -
5500 MHz-> the primary channel frequency -
width: 80 MHz-> your connection is using an 80 MHz-wide channel block -
center1: 5530 MHz-> the center frequency of that 80 MHz block
So this is a 5GHz Wi-Fi connection.
A useful mental model is:
channel number
|
V
maps to a radio frequency
channel 100
|
V
5500 MHz primary channel
txpower 22dBm is the dBm at which the antenna sending power.
The sending power is much larger than the receiving power in Wi-Fi, which is intended, because of propagation turbulences.
So that's about:
[
10^{22/10} = 158mW
]
From:
[
dBm = 10 * log_{10}{P/1mW}
\equiv
\frac{dBm}{10} = log_{10}{P/1mW}
\equiv
10^{\frac{dBm}{10}} = P
\equiv
P = 10^{\frac{dBm}{10}}
]
Now, this part:
multicast TXQ:
qsz-byt qsz-pkt flows drops marks overlmt hashcol tx-bytes tx-packets
0 0 0 0 0 0 0 0 0
It is conceptually similar to the queueing stuff we were discussing with fq_codel, but this one is specifically for multicast traffic.
-
qsz-byt-> current queued size in bytes -
qsz-pkt-> current number of queued packets -
flows-> Number of currently active flow queues associated with this multicast TX queue. The Wi-Fi stack can also use flow-aware queueing internally -
drops-> self-explanatory -
marks-> very similar toecn_mark -
ovrlmt-> very similar tooverlimits -
hashcol-> remember, 2 different flows can hash to the same bucket -
tx-bytes-> Total bytes transmitted through this multicast TX queue. -
tx-packets-> Total packets transmitted through this multicast TX queue.
And, what is:
Unnamed/non-netdev interface
wdev 0x2
addr 70:9c:d1:62:92:3e
type P2P-device
This is in fact a separate wireless device object created by the Wi-Fi stack for Wi-Fi Peer To Peer (P2P) functionality.
So instead of:
laptop -> access point -> other device
P2P allows something more like:
laptop <-> phone
The MAC address of the 2 roles of the interface are just one bit distant:
-
Normal Wi-Fi station/client ->
70:9c:d1:62:92:3d -
P2Prole ->70:9c:d1:62:92:3e
The driver/firmware can derive another MAC address for the P2P role so the same physical Wi-Fi hardware can represent multiple logical wireless roles.
There is also another command with iw, that allow to scan Wi-Fi AP even when NetworkManager is not installed.
For example, if you want to scan for 5GHz Wi-Fi access point:
FREQ="5180 5200 5220 5240 5260 5280 5300 5320 5500 5520 5540 5560 5580 5600 5620 5640 5660 5680 5700"
sudo iw dev wlp6s0 scan freq $FREQ | grep -E 'BSS|freq:|SSID:'
Output:
BSS ec:6c:9a:b2:61:47(on wlp6s0) -- associated
freq: 5500.0
SSID: Livebox-6142
BSS Load:
* OBSS non-GF present: 0
* BSS Transition
BSS 54:c4:5b:ab:80:f2(on wlp6s0)
freq: 5260.0
SSID: Bbox-1D907DCE
BSS Load:
* OBSS non-GF present: 0
* BSS Transition
BSS 82:c4:5b:ab:80:f3(on wlp6s0)
freq: 5260.0
BSS Load:
* OBSS non-GF present: 0
* BSS Transition
BSS 68:3f:7d:09:d8:75(on wlp6s0)
freq: 5560.0
SSID: Livebox-D870
BSS Load:
* OBSS non-GF present: 0
* BSS Transition
BSS b4:9d:fd:14:8a:e4(on wlp6s0)
freq: 5200.0
SSID: SFR_8AE1
* OBSS non-GF present: 0
* BSS Transition
BSS Load:
BSS a4:3e:51:33:6a:e2(on wlp6s0)
freq: 5180.0
SSID: Livebox-6AE1
* OBSS non-GF present: 0
And yess, an AP can absolutly have multiple BSSID (for a specific frequency...).
By the way, when NetworkManager is not installed, here how to connect to a Wi-Fi AP.
First, run the wpa_passphrase command that will generate a configuration file used for connecting to the AP.
wpa_passphrase "$SSID" > /tmp/"$SSID".conf
It will prompt you for the Wi-Fi password on stdin and generates a wpa_supplicant network block, something like:
network={
ssid="Livebox-6142"
#psk="your-password"
psk=381e7b36cc874c5d62ce1d6cd2ea9a7c26e4755029fa433204fc3453c3c81785
}
Then you made it explicitely readable and writeable by the owner:
sudo chmod 600 /tmp/"$SSID".conf
Remember the structure of chmod.
600
|||
|||─ others
||-- group
|--- owner
With:
-
6 = 4 + 2 =
read+write -
7 = 4 + 2 + 1 =
read+write+execute -
5 = 4 + 1 =
read+execute
Each octal (base 8) is 3 bits, (that's the literal definition), because maximum permission is 7 = read + write + execute.
And there are 3 of them.
Also, when it comes to the group of the file:
-
If the parent directory does not have the setgid bit, the file gets the creator process’s effective group ID
-
If the parent directory does have the setgid bit, the new file inherits the directory’s group
And the file owner is just the effective user of its creating process.
The directories permission also have the same triplet concept, but they mean different things:
-
r-> list the directory’s filenames -
w-> create, delete, or rename entries inside it -
x-> traverse/access entries inside it
For example:
chmod 755 mydir
means:
owner = rwx
group = r-x
others = r-x
The especially important one for directories is x.
If a directory has r but no x, we are able to see filenames with ls, but can't actually access the files inside.
If it has x but no r, we can't list the directory contents, but if we already know a filename, we can read it if the file itself gives us the permission:
So for directories:
r = "see what's inside"
w = "modify what's inside"
x = "enter/traverse it"
Soo, back to wpa_supplicant.
Whe we have done the chmod 600 command, we now do:
wpa_supplicant -B -i "$INTERFACE_NAME" -c /tmp/"$SSID".conf
-B means run in the background.
The full chain is:
-
ip link set wlp6s0 up-> enable the interface -
wpa_supplicant-> authenticate + associate with the Wi-Fi AP -
dhcpcd wlp6s0-> ask the network for IP configuration
So at this point, when we have not configured the IP address in the local network, we can't see our IP address with:
ip -4 addr show dev wlp6s0
So, finally, we just have to perform:
sudo dhcpcd "$INTERFACE_NAME"
You should see something like:
wlp6s0: offered 192.168.1.20 from 192.168.1.1
wlp6s0: leased 192.168.1.20 for 86400 seconds
wlp6s0: adding route to 192.168.1.0/24
wlp6s0: adding default route via 192.168.1.1
Which means:
-
IP address offered by the AP =
192.168.1.20 -
DHCP server =
192.168.1.1
A DGCP server is the machine/service on the local network that hands out IP configuration to clients automatically.
-
default gateway =
192.168.1.1 -
lease duration =
86400s= 24 hours
The lease duration of only 24 hours is just here to declare a deadline after which if the renewal failed, so the IP address no more in use from the AP Point Of view.
The cycle is the following:
-
0 h-> address obtained -
12 h-> first renewal attempt -
21 h-> rebinding attempt if renewal failed -
24 h-> expiration if nothing succeeded
We can also check the route packet will use with ip route.
Output on my PC:
default via 192.168.1.1 dev wlp6s0 proto dhcp src 192.168.1.20 metric 600
default via 192.168.1.1 dev wlp6s0 proto dhcp src 192.168.1.20 metric 3003
172.17.0.0/16 dev docker0 proto kernel scope link src 172.17.0.1 linkdown
172.18.0.0/16 dev br-83d249e18dae proto kernel scope link src 172.18.0.1 linkdown
192.168.1.0/24 dev wlp6s0 proto kernel scope link src 192.168.1.20 metric 600
192.168.1.0/24 dev wlp6s0 proto dhcp scope link src 192.168.1.20 metric 3003
default-> use this route when no route matches
Here the other routes all have decalred ip they take in charge (subnets 192.168.1.0/24, 172.17.0.0/16 for docker, or 172.18.0.0/16).
So if we send something to:
8.8.8.8
Linux sees no specific route (in the route table) for it and eventually uses:
default via 192.168.1.1 dev wlp6s0
-
via 192.168.1.1-> send packets to the router/gateway -
dev wlp6s0-> use the Wi-Fi interface -
proto dhcp-> this route was installed as a result of DHCP configuration -
src 192.168.1.20-> prefer192.168.1.20as the source IPv4 address for packets using this route -
metric 600-> route priority. Lower metric wins.
More on metric, first if a packet is sent to an IP adress that 2 routes take in charge with their respective subnet, then Linux first tries to choose the route whose targeted subnet is more specific to the IP address.
Example:
10.0.0.0/8 metric 100
10.1.0.0/16 metric 500
For destination:
10.1.2.3
both routes match, but /16 is more specific than /8, so Linux chooses:
10.1.0.0/16
even though its metric is worse.
If several equally specific routes match, then the metric helps choose between them.
You also see that I have dupplicated routes:
default ... metric 600
default ... metric 3003
and also:
192.168.1.0/24 ... proto kernel ... metric 600
192.168.1.0/24 ... proto dhcp ... metric 3003
This means that I have already configured the interface before.
Just to say that I can have dupplicated route.
Conclusion
We started at the application level with curl, measuring DNS, TCP, TLS, server response time and transfer throughput.
From those statistics, we needed to investigate deeper to see if our hardware was the problem.
Then iw brought us closer to the physical Wi-Fi link. A poor signal value, large numbers of retries, failed frames and beacon losses explained something that a simple download benchmark could not: the problem was not distant but the communication between the machine and the access point itself was unreliable which made the internal Wi-Fi antenna suspect number 1.
Adding the USB Wi-Fi adapter took us one layer further down. USB vendor/product IDs allowed us to identify the hardware, the kernel database told us which driver supported it, and modprobe connected that driver to the running kernel.
From there, ip link showed that even the idea of an "interface being up" has several meanings. UP only tells us that the interface is administratively enabled; LOWER_UP tells us that a lower-layer link exists; state variable describes the resulting operational state. The same output also exposed concepts such as MTUs, transmit queues and fq_codel, which showed that Linux does considerably more than simply send packets in the order applications produce them.
We also saw the networking layers:
Application
|
V
TCP / UDP
|
V
IPv4 / IPv6
|
V
Ethernet / Wi-Fi
|
V
Physical medium
An SSID is not a BSSID, an IP address is not a MAC address, an IPv4 broadcast is not an Ethernet broadcast, an ip link group is not a multicast group, and association with a Wi-Fi access point does not yet mean that the machine has an IP address or a route to the Internet.
The manual connection procedure makes those boundaries especially visible:
ip link set ... up
|
V
enable the interface
wpa_supplicant
|
V
authenticate and associate with the AP
dhcpcd
|
V
obtain IP configuration through DHCP
ip route
|
V
decide where packets should be sent
NetworkManager normally hides most of those steps behind a single command, which is convenient, but reproducing them manually makes it much easier to understand what it's actually doing for us.
Once the layers are separated, Linux gives us remarkably good tools to inspect almost every one of them:
dmesg / lsusb -> hardware detection
modprobe -> kernel driver
ip link -> network interfaces
iw -> Wi-Fi / 802.11 state
wpa_supplicant -> Wi-Fi association/authentication
dhcpcd -> IP configuration
ip route -> routing decisions
ping -> reachability and latency
curl -> application-level timing and throughput
tc -> packet queueing
Hope you found the article interesting !