1. Overall Structure
This app (repo) follows the classic three-file Shiny structure:
global.R
ui.R
server.R
Each file plays a distinct role and together they form a full declarative and reactive web app:
- global.R — shared imports, constants, and configurations.
- ui.R — the visual structure (inputs, outputs, and layout).
- server.R — the reactive logic that connects inputs to outputs.
2. 🌍 global.R — Shared Environment and Imports
The global.R file is executed once when the app starts. It defines all the shared
packages, constants, and variables used by both the UI and the server.
library("shiny")
library("ggplot2")
library("dplyr")
library("lubridate")
library("bslib")
library("readr")
library("bsicons")
library("shinymanager")
library("shinycssloaders")

credentials <- data.frame(
  user = c("admin"),
  password = c("adminpass"),
  admin = c(TRUE),
  stringsAsFactors = FALSE
)

bot_keywords <- c("bot","spider","crawler","curl","wget","python","scrapy","googlebot")
bot_pat <- paste(bot_keywords, collapse = "|")

mult_map <- c(h = 3600, d = 24*3600, w = 7*24*3600, m = 30*24*3600, y = 365*24*3600)
interval_map <- c(h = "hour", d = "day", w = "week", m = "month", y = "year")
This file acts as a shared global namespace for the app. Everything defined here (like bot_pat or interval_map) is available in both server.R and ui.R.
It also initializes the authentication system through shinymanager.
3. 🖼️ ui.R — Visual Hierarchy and Input/Output Mapping
The ui.R file defines the interface that the user sees and interacts with.
You use bslib for Bootstrap 5 theming and organize your interface with nested layout functions such as
navset_tab(), nav_panel(), and page_sidebar().
ui <- fluidPage(
theme = bs_theme(version = 5, bg = "#FFF", fg = "#101010"),
navset_tab(
nav_panel("Most Visited Pages",
page_sidebar(
sidebar = tagList(
textInput(inputId = "serverlogpath", label = "Log file path"),
fileInput(inputId = "uploaded_file", label = "Or upload file"),
textInput(inputId = "filter_ip1", label = "IPs to exclude"),
selectInput(inputId = "time_unit1", label = "Time Unit", choices = c("h","d","w","m","y")),
numericInput(inputId = "last_n1", label = "n", value = 15)
),
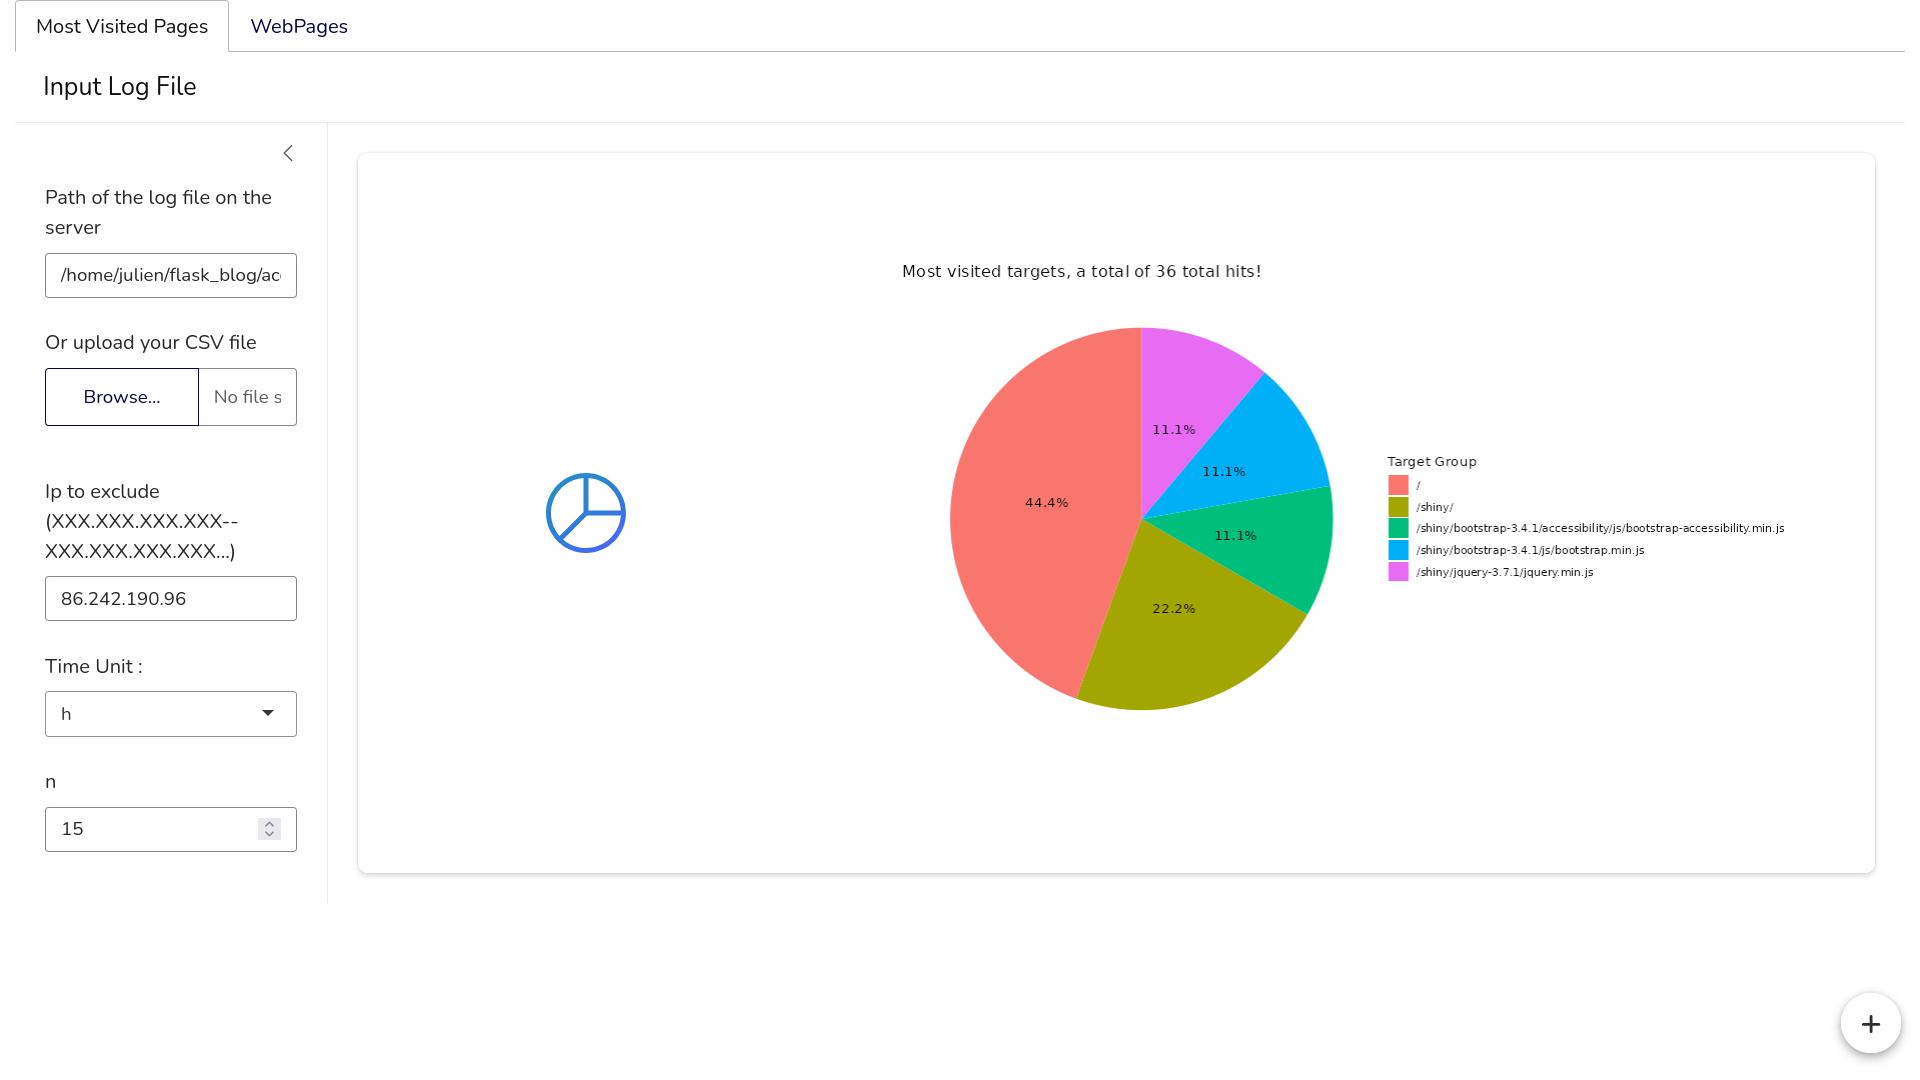
value_box(value = withSpinner(plotOutput("pie_chart")))
)
),
nav_panel("WebPages",
page_sidebar(
sidebar = tagList(
textInput(inputId = "webpages", label = "RegEx Expression", value = "^/$"),
textInput(inputId = "filter_ip2", label = "IPs to exclude"),
selectInput(inputId = "time_unit2", label = "Time Unit", choices = c("h","d","w","m","y")),
numericInput(inputId = "last_n2", label = "n", value = 15)
),
value_box(value = withSpinner(plotOutput("graph")))
)
)
)
)
Each input widget (like textInput() or selectInput()) defines an inputId —
that’s the unique identifier used to access its value on the server side as input$inputId.
Likewise, every output container (plotOutput()) defines an outputId that the server will write into via output$outputId.
Finally, your app’s UI is wrapped in secure_app(ui) to enforce login before displaying any content.
4. ⚙️ server.R — Reactivity, Data Flow, and Tab Synchronization
The server.R file is where Shiny’s reactive engine comes alive. It defines how user input is processed and how results are sent back to the UI.
🔐 Authentication Layer
At the very start, you secure the server with shinymanager credentials from global.R:
res_auth <- secure_server(
  check_credentials = check_credentials(credentials)
)
🔁 Shared Reactive Variables
You define reactiveVal() objects to store synchronized state across tabs:
filter_ip <- reactiveVal("")
last_n <- reactiveVal(15)
time_unit <- reactiveVal("h")
These are reactive containers that remember their values and automatically notify any dependent expression when they change.
---🔗 Tab Synchronization via observeEvent()
You synchronize identical widgets across both tabs. When the user changes one, the other updates automatically:
observeEvent(input$filter_ip1, {
  updateTextInput(session, "filter_ip2", value = input$filter_ip1)
  filter_ip(input$filter_ip1)
})

observeEvent(input$filter_ip2, {
  updateTextInput(session, "filter_ip1", value = input$filter_ip2)
  filter_ip(input$filter_ip2)
})
This bi-directional syncing pattern is repeated for last_n and time_unit, ensuring both tabs display consistent filters and time windows.
📦 Data Retrieval and Reactivity
Your main dataset is generated by a single reactive expression called filtered_data():
filtered_data <- reactive({
  if (!is.null(input$uploaded_file)) {
    file_path <- input$uploaded_file$datapath
  } else if (!is.null(input$serverlogpath) && input$serverlogpath != "") {
    file_path <- input$serverlogpath
  } else {
    req(FALSE, "No file available yet.")
  }

  df <- read_delim(file_path, delim = " ", quote = '"', col_names = FALSE)
  excluded_ips <- strsplit(filter_ip(), "--")[[1]]
  df <- df[!df$ip %in% excluded_ips, ]
  df
})
This block re-runs automatically whenever any of its dependencies change — for example, when input$uploaded_file or filter_ip() updates.
That’s Shiny’s reactivity model in action.
📊 Outputs and Data Flow
Outputs in Shiny are defined as reactive renderers like renderPlot().
Each one is linked to a matching plotOutput() in the UI through its outputId:
output$graph <- renderPlot({
  df <- filtered_data()
  ggplot(df, aes(x = date, y = hits)) +
    geom_line() +
    geom_point() +
    theme_minimal()
})
This corresponds directly to:
plotOutput(outputId = "graph")
The same applies for output$pie_chart and plotOutput("pie_chart").
The entire reactive chain can be summarized as:
input$serverlogpath or input$uploaded_file
            ↓
      filtered_data()
            ↓
 ┌───────────────┬───────────────┐
 ↓               ↓               ↓
output$graph   output$pie_chart  ...
Any change in inputs automatically triggers the corresponding reactive updates down the chain — no manual refresh calls are needed.
---5. 🧭 Summary of Responsibilities
| File | Responsibility | Key Elements |
|---|---|---|
| global.R | Initialization and shared configuration | Library imports, constants (bot_pat, interval_map), credentials |
| ui.R | Layout and user inputs | nav_panel(), page_sidebar(), inputId / outputId |
| server.R | Reactive logic and output rendering | reactiveVal(), observeEvent(), renderPlot() |
6. 💡 Why This Architecture Works So Well
- Clear separation between presentation (UI) and logic (server).
- Reactive synchronization across tabs via
reactiveVal(). - Global shared config through
global.R, ensuring consistency. - Declarative reactivity: automatic updates when inputs change.
- Simple extensibility: new tabs or metrics can reuse the same shared state.
7. 🔐 User Authentication with shinymanager
Because this app runs under a public NGINX endpoint, user authentication is essential.
You’ve implemented it cleanly using the shinymanager package.
Authentication is defined in two places:
- In
global.R, where you specify the credentials data frame:
credentials <- data.frame(
  user = c("admin"),
  password = c("adminpass"),
  admin = c(TRUE),
  stringsAsFactors = FALSE
)
- In
ui.Randserver.R, where the security wrappers are applied:
ui <- secure_app(ui)

res_auth <- secure_server(
  check_credentials = check_credentials(credentials)
)
secure_app() wraps the entire interface in a login screen, while
secure_server() validates credentials during server initialization.
Once authenticated, users are granted access to the app’s UI, and their session credentials are kept active until logout. This makes it easy to deploy on a shared server without exposing sensitive traffic data publicly.
This is a robust and educational architecture that balances clarity, reactivity, and modularity — ideal for both production and tutorial purposes.
Comment